Thursday, November 30, 2023

BUYING THE COLLAPSE

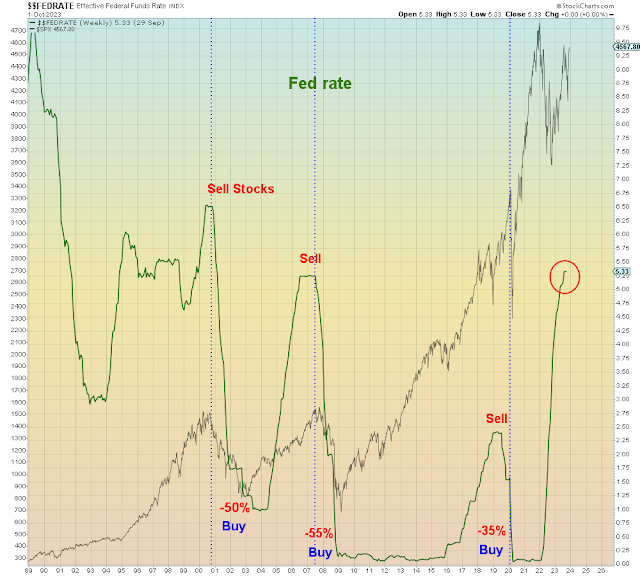
The bull case and the bear case for 2024 are now the same - lower interest rates. Bulls are convinced that low rates are good for stocks - and they are...Unfortunately, the record clearly shows that rate cuts are NOT good for stocks.


It took decades to reach this juncture at which bulls are now praying for a weak economy. The divergence between the economy and stocks began in the early 1980s with the implementation of free trade and mass immigration, but it was kicked off by Fed chair Paul Volcker who famously broke the back of inflation by pushing the economy into a double recession at 10% mass unemployment. Those events set-off a multi-decade deflationary era which has been incredibly beneficial to markets at the expense of middle class labor. Another unhealthy predilection that started in the 1980s was this market addiction to monetary policy which started in 1987 with Alan Greenspan. Over the course of the past three decades, each time the economy weakens, the Fed has arrived with greater and greater monetary bailout policy. Filed under moral hazard biblical scale.

Therefore it can come as no surprise that for 2024 Wall Street expects a recession AND higher stock prices. A brief glance at the chart above will show that none of the most recent recessions led to higher stock prices initially. It took quite a bit of pain first: -50% in 2001, -55% in 2008, -35% in the case of the pandemic.


I didn't read that article, because I'm not interested in data mining ancient history to goal-seek stock bulls' requisite answer. We can see from my own chart above that this type of  fool's errand is fraught with peril. Granted, the pandemic bear market was the shortest in history which is why it's an even greater fool's errand to believe that it was anything more than a speed bump in an aging bull market.

On a monthly chart, the pandemic "bear market" barely appears.


We were also informed this week that home prices have surprisingly reached a new all time high despite the Fed rate hikes. I'm sure the Fed was surprised to read that as well.  It clearly shows that their rate hikes are not reaching asset markets. 

Therefore we are now to believe that the Tech / housing bubble will continue to grow inexorably whether the Fed tightens OR the economy implodes.

Unfortunately for bulls, as I showed on Twitter this past week, delinquencies (adjusted for inflation) have now reached the same level as 2008. Except, the difference is that back then interest rates and home prices had ALREADY peaked and were coming down. Whereas now, neither is coming down yet. 

More importantly, we see that delinquencies continued to rise long after home prices began to fall.

In summary, what we are witnessing is the largest policy error in market history. Bought with both hands by complacent bulls at the behest of known con men.

How this was always going to end. 


Thursday, November 23, 2023

BLACK FRIDAY

The day after Thanksgiving is named "Black Friday" because historically it was the first day of the year that retailers were "in the black" financially. Meaning, turning a profit. Almost an entire year of sales comes down to the last five weeks of the year. One could say the same about this market - an entire year of panic buying "stocks" and the whole year is now in the balance of these next five weeks...


To begin, let's review the year to date, using the chart above as reference. The equal weight shows that the YTD break-even has been a key pivot point for stocks all year long. The year began with tremendous optimism towards China. The country that infected the world with pandemic was finally emerging from the pandemic by exiting all lockdown protocols. Chinese stocks, led by Hong Kong, vaulted off of the November 2022 lows and reached their peak of 2023 at the end of January 2023, as marked "China rally" above. That was it. The high of the year for Chinese stocks. The next thing you know, China RISK OFF imploded global markets and sparked a U.S. bank run.

As we all know, several large regional banks failed at the March low, but the FDIC found buyers for the largest ones and fully bailed out the smaller banks. Crisis solved. However, in May of this year, the FDIC wrote a memorandum stating that the FDIC Deposit Insurance Fund (DIF) is at risk of depletion, and they will not be able to fully bail out uninsured depositors (aka. > $250k per account) going forward. Their proposal is to bailout above the $250k limit ONLY if the deposit is a working capital  aka. "payroll" bank account for a business. What they call "targeted" coverage. Nevertheless, the main takeaway is that of course nothing has changed since the Spring bank run. Except that risk has increased exponentially. 

Here are some highlights of their report, which you can read yourself:

"Trends in uninsured deposits have increased the exposure of the banking system to bank runs"

"Technological changes may increase the risk of bank runs. The speed with which information, or misinformation, is disseminated and the speed with which depositors can withdraw funds in response to information may contribute to faster, and more costly, bank runs"

"From year-end 2009 through year-end 2022, uninsured domestic deposits at FDIC-institutions increased at an annualized rate of 9.8 percent, from $2.3 trillion to $7.7 trillion"

For comparison, the Deposit Insurance Fund equals $117 billion. 

Notably, the report only casually mentions the ongoing threat of massive bank unrealized losses due to the bond market collapse. During the pandemic, banks had a massive inflow of new deposits arising from the various stimulus programs, so they did the easiest thing with the money which was buy long-term bonds. Since interest rates have exploded higher, those bond portfolio values have collapsed, leaving a ticking time bomb on bank balance sheets, as you can see below:


Going back to the first chart above, the second rally of the year was driven of course by the Artificial Intelligence Tech blow-off top. We can view the Tech rally from the perspective of a three year topping process that began back in early 2021 with the peak of the "Work from home"/ ARK ETF / IPO SPAC junk. The second peak was in late 2021, at Thanksgiving,  which is something I point out on Twitter all the time because the Nasdaq all time high was in the days prior to Thanksgiving. 

Interestingly, the 8 day moving average of the ISEE call/put index this week, was the highest since the Nasdaq all time high.


Here is where it all comes together:
AI leader Nvidia released their earnings on Tuesday night but the stock imploded on Wednesday. Their earnings and sales handily "beat" expectations, including a 200% year over year increase in sales. The problem is that the stock is already up 400% year over year. The second problem is that going forward, they forecast much weaker sales out of China (which accounts for 25% of their total revenue), due to the recently-imposed U.S. semiconductor export restrictions.

In other words the leading sector and the one that made new highs this fourth quarter is about to experience a drop in sales. Because what Nvidia didn't say - and no Wall Street analyst thought to mention - is that Nvidia will not be alone in being affected by export restrictions to China. 


This is going to affect ALL U.S. semiconductor companies.


The article of the week has to be this one explaining that hedge funds are now record crowded into Tech stocks, with TWICE the weight in Tech that they had at the beginning of the year:


"Megacap growth and technology stocks accounted for 13% of the aggregate hedge fund long portfolio, twice their weight at the start of 2023"

However, as popular positions gain momentum, there is a growing risk of crowding, which reached its highest in the 22 years since Goldman started tracking the funds"


This week through Wednesday caps Tech's largest four week run % gain to a new all time high since Y2K.


What does this have to do with banks?

As the Nasdaq oscillator shows, they're as overbought as they were at the beginning of this year when China risk off imploded global markets. 


In summary, the lesson learned is don't ignore what's going on outside of your own little world, because the FDIC has already said that next time there's not enough bailout to go around.


Friday, November 17, 2023

END OF YEAR: END OF CYCLE

The market is peaking too soon this year for an end of year rally. It's now overbought and investors are ALL IN. Therefore, the bull case is now based upon presumed recession...


This week's "weaker than expected" CPI added fuel to the burgeoning end of year rally. Somehow a core CPI of 4% - twice the Fed's target average - has given investors the belief that Fed rate cuts are imminent. Of course, that delusion was aided and abetted by copious pundits who have no skin in the game other than to placate desperate bulls. As the article above states, the only way the Fed will cut rates is in a recession. Under a recession scenario, stocks are now massively overvalued compared to Treasury bonds. Recall that the mantra of bulls since rate hikes began is that inflation is good for stocks and bad for bonds, because earnings can grow faster than inflation. In a deflationary environment, that mantra reverses as earnings collapse.

Just on time: Walmart's CEO warned this week that deflation is now imminent due to the weakening consumer:


"Prices have fallen, especially on general merchandise and on some key grocery items"

"Yet the discounter struck a cautious tone, saying customers continue to watch their spending"


Lower prices AND cautious spending, that's a precursor to recession.

I would suggest that deflation has already arrived for Walmart's stock which made a new high earlier this month and has now collapsed. Note that this WMT implosion is occurring exactly where I marked wave 'iii' down on the S&P 500. And where wave 'iii' down occurred in 2022.  


In another sign of deflation, oil is collapsing, which comes as a  total shock to every oil analyst on Wall Street.


Far worse yet for bulls is the fact that Tech stocks are now completing the fifth wave blow-off top that started in the fourth quarter of LAST year. As we see below, the pandemic was the steepest part of the Tech rally, leading to the wave '3' top. Then a pullback to the 200 wma, and now the final rally.

And yet bulls honestly believe that this is the beginning of a new end of year rally driven by imaginary Fed rate cuts. 

They are fantastically delusional. 


Zooming in on a tighter timeframe, we see that Nasdaq new highs are deja vu of the November 2021 top. In the case of the Nasdaq however, that index along with the broader market was not able to confirm the new Tech top. Which should have been another warning sign to bulls. Note also that this year the broader market peaked in July versus November.


The Tech high which is unconfirmed by the entire rest of the market is why this is the weakest rally in terms of breadth of the past year. Note that the average stock has not even made it back to the 200 dma while the Tech ratio goes parabolic:


In summary, the market is now overbought, but this time Tech can't save the market from imploding as it did earlier this year during the bank run. Which means bulls are now facing bank run and Tech collapse at the end of the year.

And the end of the cycle.


Just like last time.


Friday, November 10, 2023

FRONT-RUNNING EXPLOSION

It's that time again when bullish investors are tripping over each other to onboard risk ahead of year-end. All signs indicate bulls may have peaked too soon. Again...


Below we see the S&P 500 volume oscillator. While there have been many bear market rallies from this level of oversold, there were no long-term buying opportunities at this current level. In addition, we see that this indicator is now three wave corrective. 

Compare this current set-up to the one last year.  


On the monetary policy side this week, several Fed members  including Powell were yet again forced to inform markets that inflation is not yet under control. This repeating cycle of markets front-running Fed easing followed by a tighter Fed has been repeating for over a year now. 

Nevertheless, it's that time of the year when the "seasonals" are positive which means that fund managers are aggressively putting money to work. In addition retail investors have also aggressively switched from bearish to bullish. Notice the pattern below (AAII) of u-turn positioning is deja vu of the all time high in November 2021. Also, crypto Ponzi schemes have been leading the market lately as proof that risk appetite is fully lubricated. Nevertheless, we are informed that crypto Ponzi schemes are a "safe haven" from global markets, just not a safe haven from rampant criminality. It's totally fitting that in the week after Sam Bankman was indicted for massive fraud, that this society is now embracing a level of general market fraud that will make his pissant FTX seem like chump change. Deja vu of Bernie Madoff circa 2008, all eyes are on the small scam artist while the big guys are getting away with deception on a biblical scale. It's like the scene in Airplane! where the old lady is getting the shakedown from security, while armed mercenaries are walking through with machine guns. 

One article I read this week couldn't understand how Bankman's upstanding Stanford Professor parents allowed him to commit such fraud. It's easy - we live in a morally dead society. Case closed. No ads to sell.


On the topic of flirting with disaster, global carry traders are now ALL IN the $USD/Yen carry trade despite the fact that the BOJ is removing all easing and the Fed is trying to pause. 

This chasmic central bank policy divergence that grew larger and larger for the past two years is now closing, and it's the biggest risk that no one is discussing.

Notice the difference (lower pane) with the $USDJPY now versus during prior Fed pivots:


Another colossal risk being ignored is the total collapse in market breadth. Today, Microsoft made a new all time high which was unconfirmed not only by the Nasdaq 100, but also unconfirmed by every other mega cap Tech stock.

Which is why the Tech/equal weight ratio is now vertical.


And then there's this impending government shutdown which  perfectly sets the table for a totally non-functioning government in the depths of winter meltdown. The last Speaker (McCarthy) was shit canned for making a deal to keep the government open, so we are told the new Speaker who is even more conservative will make another deal with Democrats?

Putting it together gives the worst end of year risk profile since 2018. Which was the last time markets imploded at year end. 

Bought with both hands. 


Sunday, November 5, 2023

2023: REVISITING REALITY

It's time to step back for larger perspective...


From time to time, one must step back to put today's economic events back into their broader context. In retrospect, we now know that the 2008 global financial crisis placed the U.S. and developed world in a state of deflationary Japanification. No growth and 0% interest rates for a decade straight. It was a frustrating time to be an investor, because fundamentals no longer mattered. Only monetary policy mattered. 

Fundamentalists believe that the economy and profits are what drive stock prices. Whereas Elliott Wave purists believe that sentiment and social mood are what drive the economy and stock prices, fundamentals merely follow. I am in the middle camp. I believe that there is a feedback loop between fundamentals and sentiment. When sentiment is RISK ON, demand increases, the fundamentals improve, profits follow. Higher profits stimulate asset prices which in turn raises speculative appetite. 2008 changed all that. Central banks were in direct control over markets for over a decade.

However, now the pandemic has put markets back at the mercy of sentiment and fundamentals. Central banks are no longer supporting markets at this late juncture. Whereas fundamentals can be hard to predict, sentiment is much easier to observe. In late 2021, global risk asset markets hit all time highs, followed by the 2022 bear market. 2023 has been a retracement correction of that bear market.  

This is my weekly wave count. Note that the bear market of 2022 started the same way this decline is starting. With a falling wedge to wave 'i' down, followed by a bear market rally to wave 'ii' up.


Given that we saw this exact same pattern last year, today's unfolding collapse should be very clear to everyone, but it's not. Why? Because Wall Street relies solely upon their proprietary profit models to predict stock prices. What I call the Magic 8 Ball. Their predictions always fail at the end of the cycle.

Which is why it has never been more important to observe risk sentiment in order to confirm market direction. Below is a chart of airline stocks and consumer sentiment. What we notice is that both airlines and sentiment peaked prior to the pandemic. Subsequently, airlines have enjoyed two counter-trend rallies, each of smaller magnitude. Recently, airlines broke below the 2022 bear market lows, in an ominous sign for the rest of the stock market. During the pandemic, global travel was curtailed for two years straight. If any sector should have benefited from re-opening, it's airlines.  


Another indicator of collapsing social mood can be viewed in the artificial intelligence Tech sector, which was the biggest bubble of 2023. These stocks have fallen into a bear market. Note also that they peaked back in late 2021 at the same time that monetary stimulus peaked. More proof that central banks exert tremendous control over markets. More than fundamentals AND sentiment combined. 


This past week, investors bought the dip on the belief that stocks rally for about a year after the Fed pauses. But guess what, we were told the exact same thing last October. Which was the catalyst for a year-long rally. Now bulls are buying a recession rally, not realizing there is no such thing. 


Next, let's talk about inflation and the impending return of deflation. The sources of inflation emanating from the pandemic were first and foremost the unprecedented monetary quantitative easing which dwarfed the stimulus applied after 2008, or any other period in history. QE drove asset prices across the board to ludicrous extremes. Elon Musk saw his wealth increase 10x in less than two years. Yes, you read that right - from $30 billion to $300 billion. Owners of assets - homes, condos, and stocks - were made instant millionaires. Mostly Boomers. Meanwhile younger generations were locked out of  over-priced markets and then systematically bilked by rampant pump and dump schemes. Think of the collapsed FTX crypto exchange and Sam Bankman who was just convicted this past week of rampant fraud. The Big Short author Michael Lewis  was calling this criminal a "genius" right before FTX collapsed. You can't make this bull shit up. The amount of fraud in this era eclipses any other era in modern history. Nevertheless, the millionaire/billionaire wealth effect continues to drive inflation across the economy. Meanwhile, retailers are warning that middle class and low income consumers are imploding: 

“Wealthier folks are still spending, especially on international travel, blowout entertainment and other services and experiences”

"...low-income families are pulling back now that federal stimulus and pandemic-era savings have run out, and middle-income families, who are “selectively trading down” by buying paper towels at the dollar store"


Pandemic stimulus was a source of inflation, but those programs ended two years ago. Interest rates cuts fueled inflation for a time, but rates have now tripled from their levels before the pandemic. Which leaves interest rates above their 2007 levels. 

In other words, we are to believe that the post-2008 deflationary paradigm is over, having been replaced by even more extreme asset prices, far more debt, and sky-rocketing interest rates. 

Here we see that home prices have continued to defy gravity. However, back in 2007 home prices didn't implode while rates were rising, they imploded while rates were declining.

And guess what, interest rates are set to now decline.  


In summary, the party is over. But the wealthy are still partying like it's 1929. Because, guess what, for them that's what this is.

Position accordingly.


Thursday, November 2, 2023

FOMC: FEAR OF MISSING CRASH

Bulls claim the term "crash" is way over-used. More appropriately, we should adopt the term "discontinuous price discovery". That way it's left to the reader to decide if they require a change of underwear...


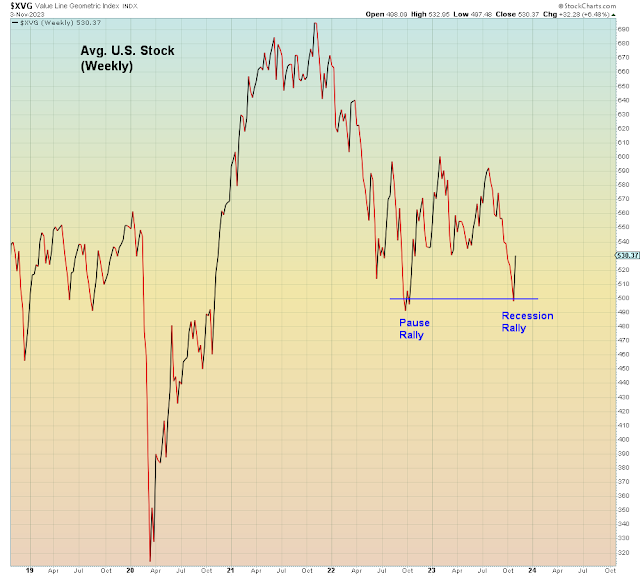
Recap:  October capped off the largest three month decline since March 2020. So far, no sign of panic or capitulation. Whenever the market gets oversold it bounces, and then goes lower. This has been the pattern since the July top. Here we see that the market is in a clear down-trend, with each rally of shorter duration. There was an oversold bounce at the last FOMC pause in September. On Wednesday of this week, the Fed paused rates for the second meeting in a row, for the first time since they started raising rates. This is the scenario bulls have been waiting for all year long.


The Nasdaq is in a similar downtrend and currently clinging to the 200 day moving average.

Today after the close, we get Apple earnings. As I pointed out in my last blog post, Tech earnings have so far been met with heavy selling. Including beats. But Apple is expected to post another earnings decline, so that should be better?


"There are four forces working against Apple in the December quarter: An unfavorable comparison, a strong dollar, iPhone supply issues, and a cautious consumer"


Bulls inform us that it's bullish we avoided a recession and it's also bullish that the Fed has ended rate hikes. However, for the bulls, now every economic data point is a potential landmine that could set-off another round of Fed tightening. For example, Friday's jobs report.

Meanwhile, earlier this week the BOJ further widened their yield band and said that the 1% level is now merely a "reference" point. Which means that if U.S. economic data runs weak, the yield gap between U.S. and Japanese rates should continue to close, trapping bulls in collapsing carry trades. 

In other words, both the "too hot" scenario AND the "too cold" scenarios are now fraught with delusional risk.


In summary, the average stock almost took out the last October lows during the past month, but the cap weighted averages shown above remain significantly above the lows. 


Which means that now the bet is whether or not markets collapse between now and the end of the year.